Lawnlite: A Foray into Weather Radar
What I learned while implementing weather radar into an interactive map
Introduction
This turned out to be a cavern-sized rabbit hole, involving many hours of research, tinkering, desperation, crying (kidding, I only cry when I write Rust) and perseverence.
In case you don't already know, Lawnlite is an app I am building for lawn care companies. It's going to manage their Clients, Routes, Employees, Time Tracking, and hopefully with a bit of careful consideration, it will actually be good at doing so.
There is one clear competitor out there that shall not be named, and while they're quite full-featured, they lack some fundamental features for lawn care businesses as they grapple with supporting other business types like pest control.
Which brings us to weather prediction and radar, which as it turns out, can be quite a fundamentally important thing for lawn care businesses.
Lawn care businesses typically don't work when its raining, for obvious reasons. And as a person who worked for a lawn care business for several years, I know very well that there is a decision involved each day where it may potentially rain.
The thought typically goes from whether or not to call the day off completely, to whether its appropriate to risk calling in a bunch of employees only to pay them for an hour before sending them home for the day.
This dilemma along with a variety of weather variables makes this a gambling act from the position of the lawn care business owner.
The Benefits
You might be thinking, why would someone go through the effort of building a weather integration - let alone weather radar into a lawn care application?
Good question, reader.
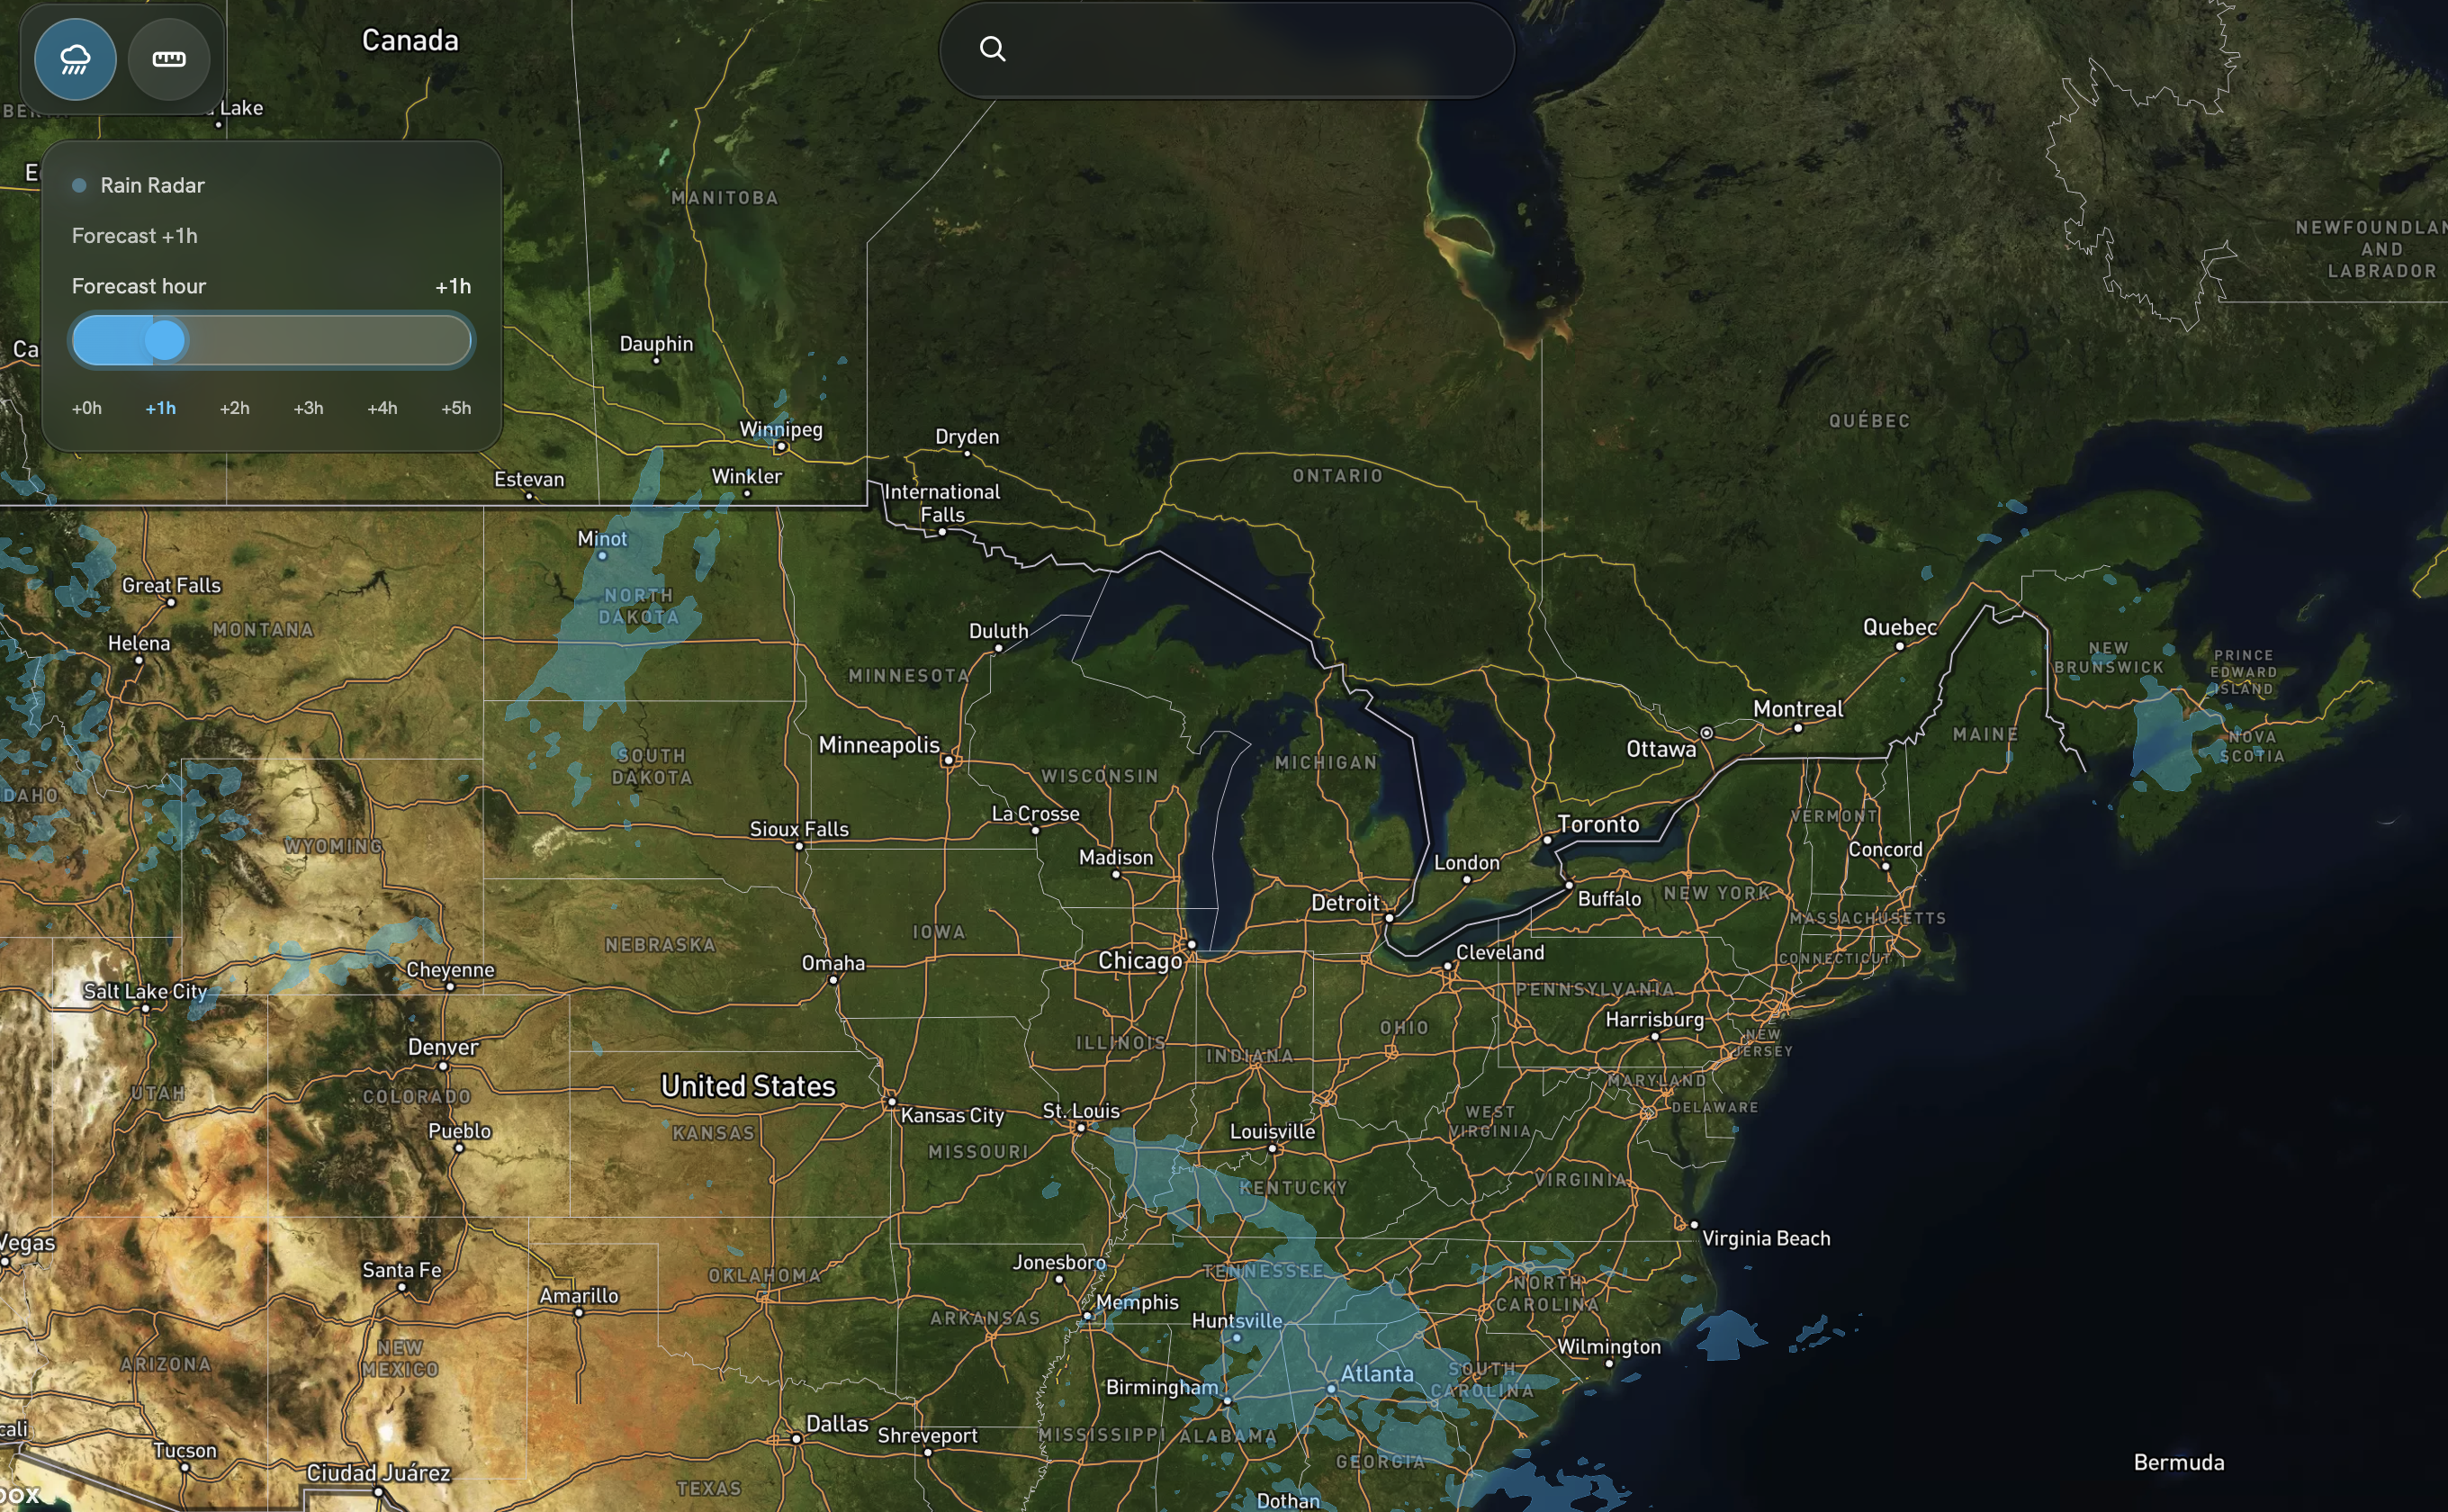
Imagine this: the business owner opens up Lawnlite to see that a bunch of the properties and routes they are going to visit today are going to be rained on, so they click on a button to recalculate their routes to avoid the rain and focus on properties that will still be clear. See what I mean?
That's the kind of killer feature that my less lawn-focused competitor does not have, or at the very least, doesn't want to go through the trouble of implementing.
The Problem
So that sounds all fine and dandy, let's just implement this novel feature and be good to go right? Wrong. When I said this turned out to be a rabbit hole, I meant it.
The problem is Map tiles.
Map Tiles
If you didn't know already, digital maps work on the concept of map tiles. As you zoom into a map, typical map software will populate sections of the map with images of the ground.
My map provider, Mapbox (based on OpenStreetMap) provides this functionality so that you can easily add new layers to the map and overlay new data. However, I was surprised when they didn't offer any prebuilt map tiles for weather radar, considering that they do so much already for navigation tiles, satellite imagery, etc.
They do allow you to create, publish, and share your own map tiles within their platform, which sort of helps us. However they don't provide weather map tiles, and good, cheap sources of weather map tiles will remain an epiphany as soon as I find a provider - but I haven't yet.
Cost
It turns out there are many commercial providers providing weather data and weather APIs and map tiles for consumption. The only problem? They cost money. How much money? Well let me first break down something important:
- A map has to load many tiles depending on how you zoom in, a typical session could download anywhere from 10-1000 tiles, and that's before we get into forecasting where new tiles might load.
- These providers often charge 15 cents per 1000 API calls, which in my case, means that each time the map loads, without considering viewing into the future, it might cost 15 cents.
I looked at a few providers, namely OpenWeatherMap, Windy, Rainviewer (free but now discontinued), Xweather, and a few others.
Some commercial providers offer a free tier, but typically restrict it to 50,000 API calls per month. For testing and development purposes alone, it's likely that I would consume the entirety of the free tier for a given month before my customers even had a chance to use it.
Rolling My Own
After spending countless hours contacting companies and trying to figure out cheap reliable sources, trying out different commercial APIs, I finally decided to go through a different approach. Seeing as I couldn't use a commercial provider, it meant that I would have to somehow retrieve my own weather radar data, convert it into a visual format, split it into map tiles, and then serve the map tiles on some form of CDN to my end user.
This turned out to be a bit of a journey.
The Solution
While it wasn't immediately obvious, one of the first places to start was to try and look for raw sources of weather data. In the end I ended up finding out that the National Oceanic and Atmospheric Administration (NOAA) provides quite a bit of weather data (and forecasting!) for free to the public. It turns out they have a lot of different sources for this weather data that I had to learn about, which I will dive into later. This is what I ended up using for my final product.
The second place I found data was through Environment and Climate Change Canada's (ECCC) and Meteorological Service of Canada's portal. They seemed to use ArcGIS and they exposed their data through an API as well. Let me tell you when I say it is not a very nice API.
Anyway, they provide a Web Map Service through their MSC Geomet Portal. During my first attempt at making weather radar, this is what I used.
Now obviously, my product is targetting the North American market, and I wanted to have weather radar capabilities for the entirety of the North American market, not just Canada's. But because Canada's was simpler, I went with that at first.
MSC Geomet WMS
As it turned out, implementing Canada's realtime weather radar was simply a matter of overlaying the image produced from the WMS API over top of the map, as their API worked with a bounding box, a width and a height for the image. It also had support for the common EPSG:3857 format.
https://geo.weather.gc.ca/geomet?SERVICE=WMS&VERSION=1.3.0&REQUEST=GetMap&LAYERS=RDPA.24F_PR&STYLES=RDPA-WXO&CRS=EPSG:4326&BBOX=35,-150,85,-45&WIDTH=600&HEIGHT=400&FORMAT=image/png
    const wmsBase = "https://geo.weather.gc.ca/geomet?SERVICE=WMS&VERSION=1.3.0&REQUEST=GetMap&FORMAT=image/png&TRANSPARENT=true"
    const wmsParams = "&LAYERS=RADAR_1KM_RRAI&STYLES=&CRS=EPSG:3857&WIDTH=256&HEIGHT=256&BBOX={bbox-epsg-3857}"
    mapInstance.addSource(sourceId, {
        type: "raster",
        tiles: [wmsBase + wmsParams],
        tileSize: 256,
        attribution: "Radar © MSC GeoMet / ECCC"
    })
    // Add layer on top
    mapInstance.addLayer({
        id: layerId,
        type: "raster",
        source: sourceId,
        paint: {
            "raster-opacity": 0.5,
            "raster-fade-duration": 0,
            "raster-resampling": "linear"
        }
    })
Adding this to the map showed realtime weather radar for areas within Canada, and best of all, it was free.
Problem
The only problem is, that while it did provide current weather data, it didn't provide future weather data or predictions. The resolution was also somewhat poor. Have a look at what it looked like below:
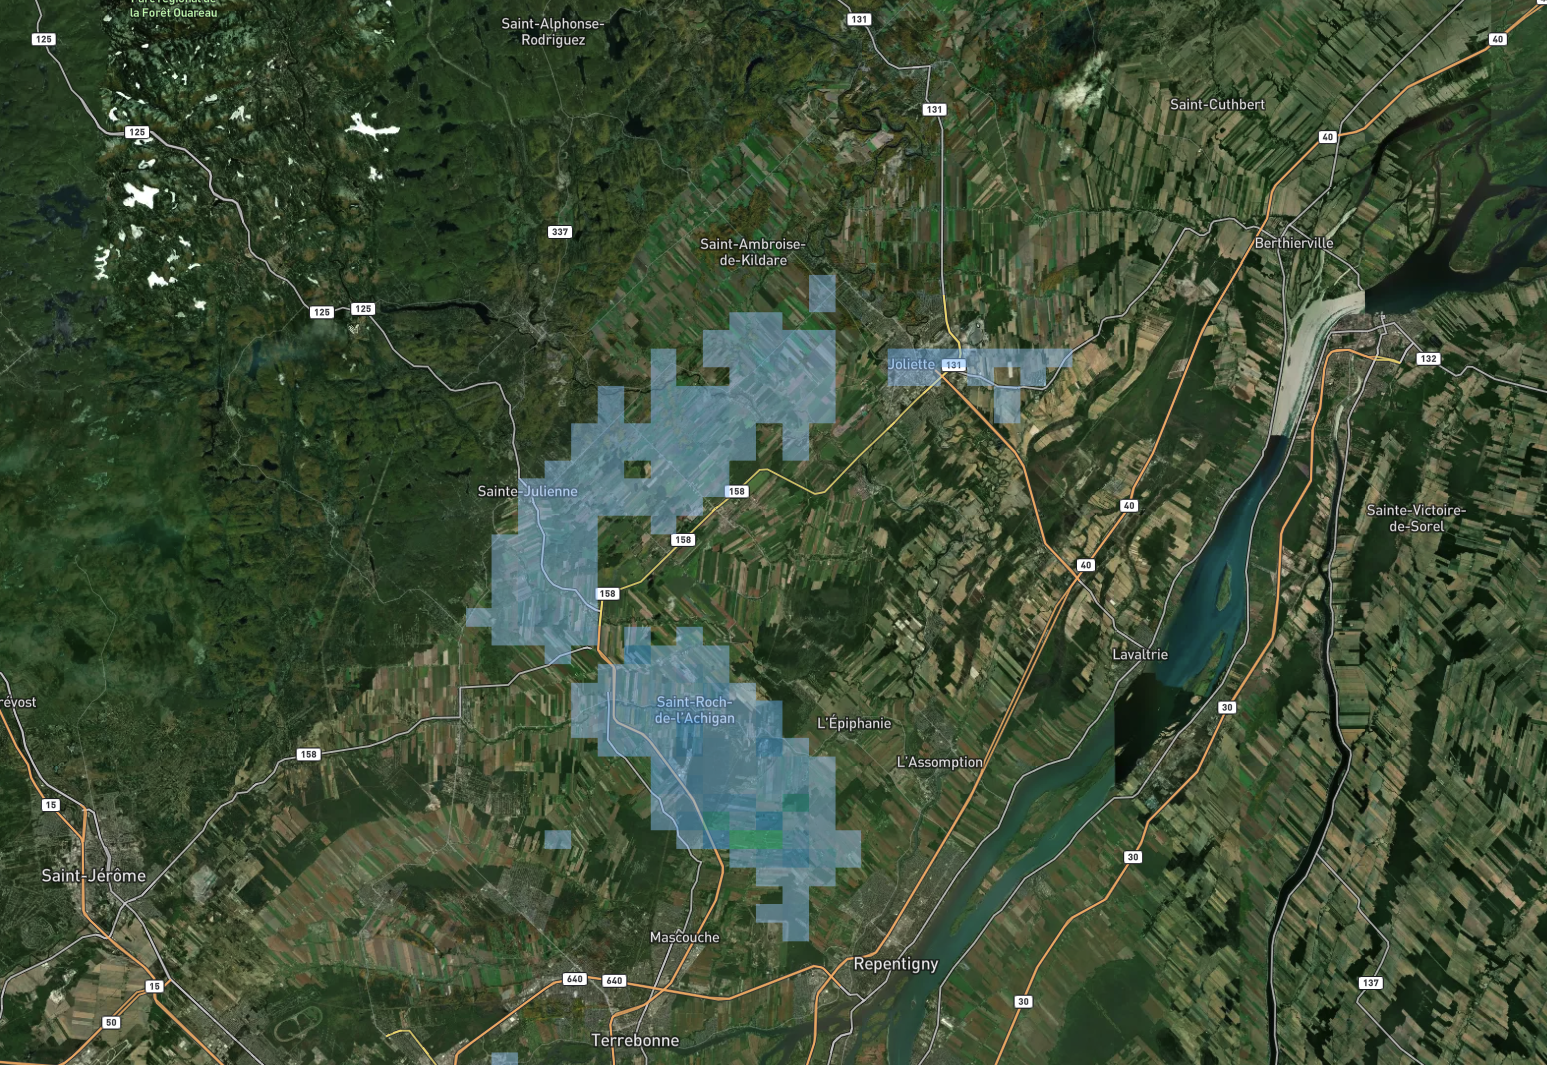
As you can see, the rendering appears a bit blocky and square, as opposed to the smooth contours that you're used to when you see a weather map.
This was unfortunate because it meant that I was definitely going to have to go through the route of trying to build weather map tiles myself.
NOAA's Solution NOMADS
So rather than relying on a government's prerendered images to overlay on a map, I would have to generate these images using the raw data myself. Admittedly, with the help of AI, this turned out to be a clusterf*** with it making a shit ton of simple mistakes or not thinking things through fully. In the end I realized I couldn't just ask AI to implement it for me as I had hoped, dreading the long hours I would have trying to build a pipeline for it. But in the end I found a place to start: selecting and finding weather models for my predictions, and a good source for current radar data.
HRRR
So NOAA through their NOMADS project, provides a ton of public radar data and prediction models. Some of which are used throughout the United States for various purposes. While each model and radar service has different requirements, quirks, and what not, it was possible to find a good model for short term forecasts. It's called High Resolution Rapid Refresh (HRRR), and it provides radar forecasting for a good chunk of North America.
Have a look at the NOMADS website here.
The only problem, is that their data was in a format called GRIB2. Which as far as I know is a format containing raw weather information that I had never heard of. I'll spare you the details, but in the end I essentially has to use a few libraries and create a Python pipeline to download the correct GRIB2 files for the current time (they rerun predictions every hour, and forecast for 18 hours into the future if I remember correctly), then convert the raw data into polygons with contours, convert that to GeoJSON, and then run it through an application called Tippecannoe which generates the map tiles.
I had to do that for every forecast hour, and I later realized I could filter the GRIB2 files using NOAA's helper tool online for surface level REFC data to get precipitation data.
This saved downloading datasets that were hundreds of megabytes in size and contained a lot of extraneous information.
MRMS
The next step was to get realtime weather data. Luckily, NOAA also has a system called Multi-Radar/Multi-Sensor (MRMS) which not only provides current radar information, but filtered radar information. Typically, radars measure rain in a given area by measuring the reflectivity of particles in the air. When this data is unfiltered, different anamolies such as buildings or other environmental issues can cause noise in the data. The beauty of this MRMS system is that it also combines radar from multiple sources, including radar on the Canadian side, where I live, and then filters it (they call it QC'd data).
The only real difference between this and HRRR is that they don't have an online filter tool to filter through all of the data contained in the GRIB2 files. They require that you manually select the product by filename (each measurement type gets its own GRIB2 file). Here is the code I wrote to retrieve the MRMS GRIBs:
# In my case the product was "ReflectivityAtLowestAltitude"
def _build_mrms_url(product: str, timestamp: Optional[dt.datetime] = None) -> str:
    """
    Build MRMS data URL for a specific time.

    Args:
        product: MRMS product name
        timestamp: Time to fetch (None = latest available)
    """

    base_url = "https://mrms.ncep.noaa.gov/data/2D"
    if timestamp is None:
        timestamp = dt.datetime.utcnow()

    # MRMS filenames:
        # - MRMS_PrecipRate_00.00_YYYYMMDD-HHMMSS.grib2.gz (Was the wrong data, tried that first)
        # - MRMS_ReflectivityAtLowestAltitude_00.50_YYYYMMDD-HHMMSS.grib2.gz (Eventually realized I was looking for reflectivity data)


    # Times are usually on 2-minute boundaries
    ts_str = timestamp.strftime("%Y%m%d-%H%M%S")
    filename = f"MRMS_{product}_00.50_{ts_str}.grib2.gz"
    return f"{base_url}/{product}/{filename}"


def _nomads_hrrr_url(yyyymmdd: str, HH: str, lead: int) -> str:
    FF = str(lead).zfill(2)
    # HRRR filter for 2D surface variables
    base = "https://nomads.ncep.noaa.gov/cgi-bin/filter_hrrr_2d.pl"
    query = {
        "dir": f"/hrrr.{yyyymmdd}/conus",
        "file": f"hrrr.t{HH}z.wrfsfcf{FF}.grib2",
        "var_REFC": "on", # This filters the grib2 for reflectivity
        "lev_surface": "on", # This provides data on the surface (but I don't think this flag is working)
        "lev_entire_atmosphere": "on", # This provides data for the entire atmosphere (which is needed for REFC)
    }
    return f"{base}?{urlencode(query)}"
After that, it was as simple as running it through tippecanoe using the same pipeline as I did before, and I was all set.
Trials and Tribulations
Or at least in theory, because as it turns out - when you're trying to build a complex system with many moving parts, you can almost always guarantee that something along the chain isn't going to work properly on the first try. Barring some kind of voodo shit.
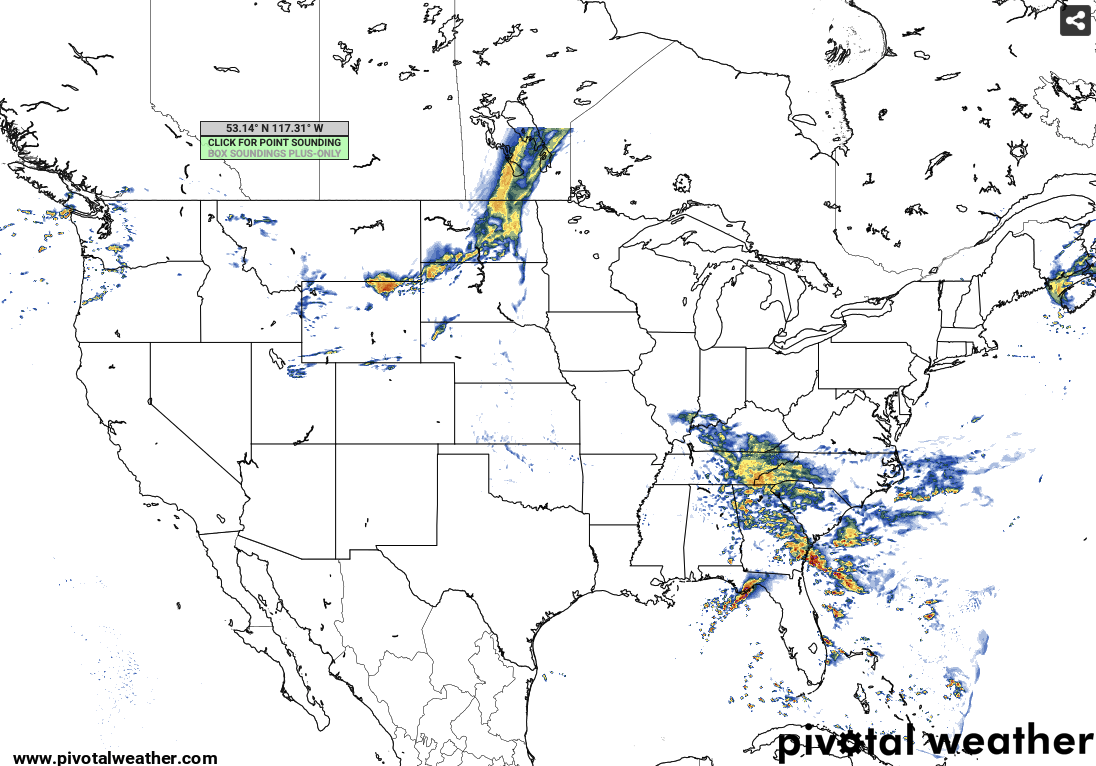
One of the major problems I encountered was incorrect projections of the data onto the map. Specifically, my algorithm kept putting all the weather radar data north of where the rain was actually happening. This ended up being a problem I only noticed later on, as I was comparing my data to the actual weather data.
See here:
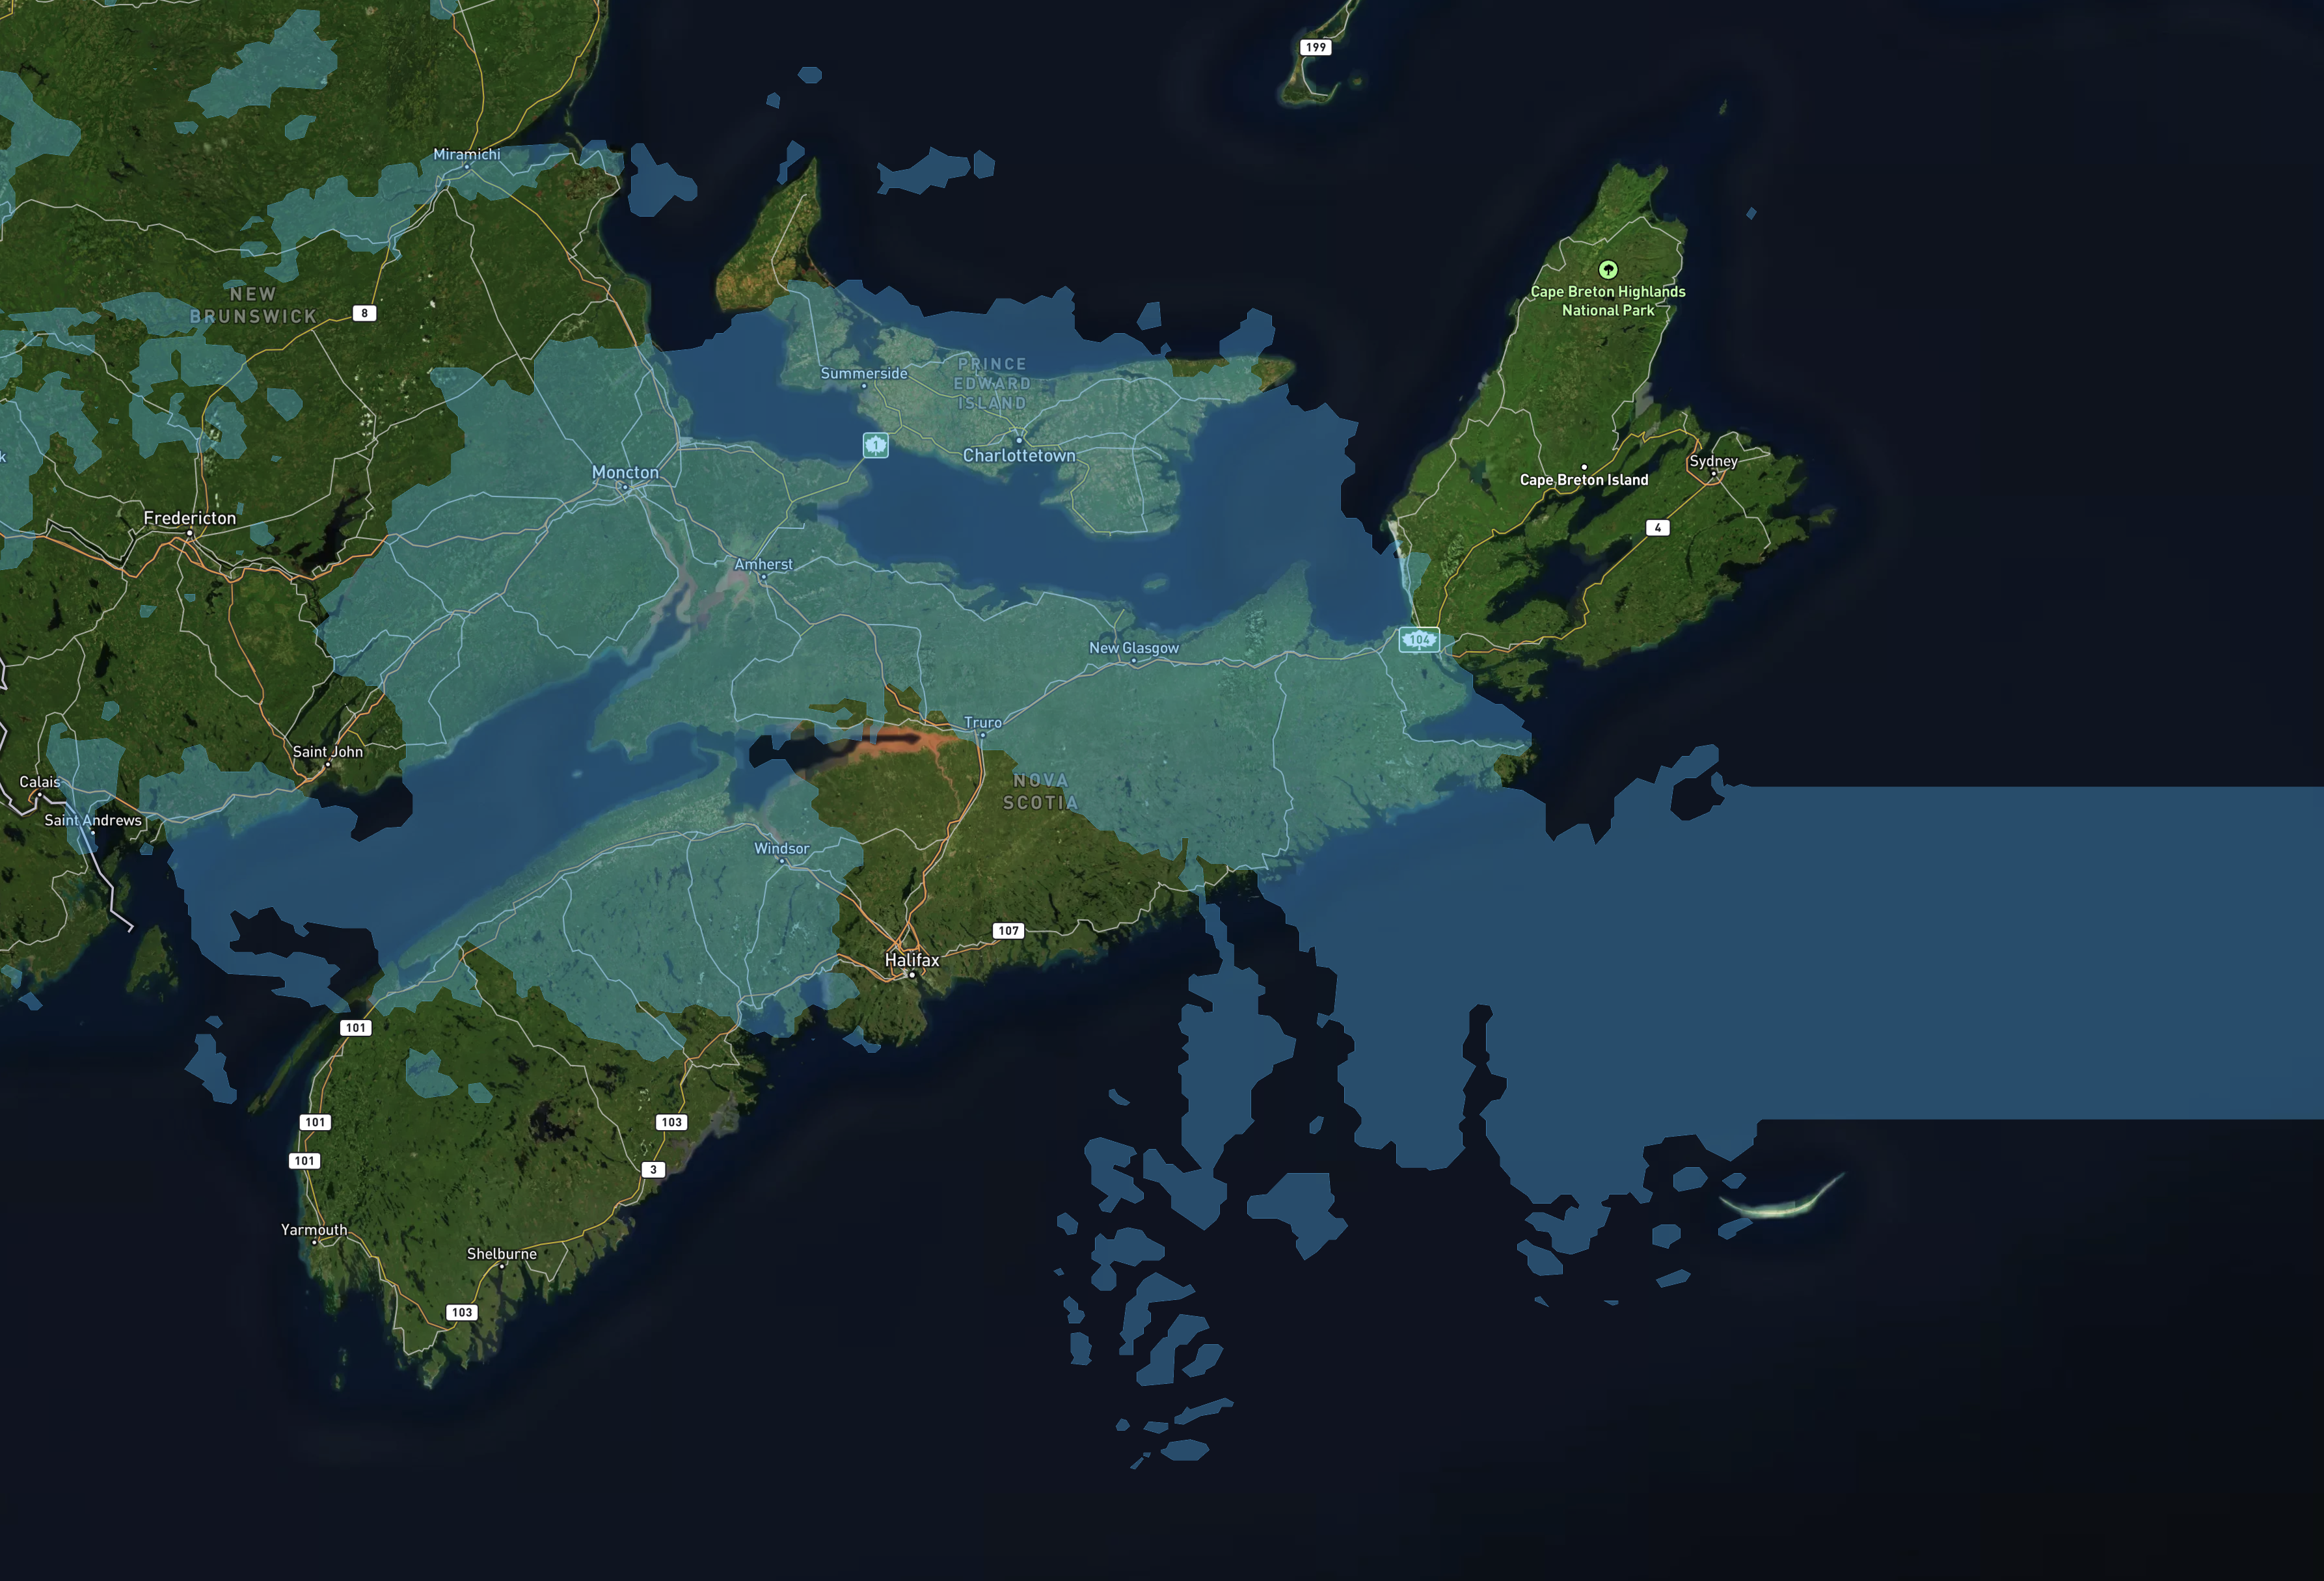
And the difference with my implementation:
Notice how the rain in Nova Scotia is slightly higher than where it actually is in the reference map? It wasn't too difficult to fix, with the help of AI I was able to identify a Y-Axis flip when converting my array of contours back to latitude. That solved the positioning issue.
There was also another issue where the rendered data wasn't quite the same shape as the reference data as well, that turned out to be because I was using the PRATE variable in the GRIB2 file instead of what I actually needed to use, which was REFC which is for reflectivity. I thought that PRATE standing for Precipitation Rate meant rain, and while it does, its actually a prediction in and of itself, as radars typically only measure reflectivity as far as I know.
Fixing that was one hurdle, I then had a hurdle where towards the edge of the map, sometimes the precipitation gets expanded in a bar like form, see below:
That ended up being related to some form of clipping issue, that I have mostly resolved, but more work needs to be done to get it working.
Conclusion
I am obviously glossing over a lot of details. One of the hardest parts was knowing exactly where to get the weather radar information, and this required a lot of research. The links I provided above are current (at the time of this writing) sources for GRIB2 data. But I suspect they will change over time.
Was it worth rolling my own weather radar implementation or using an API? Only time will tell. But now that I have weather data in Lawnlite, it's one more feature I can cross off my list.
Stay tuned for more updates to this feature!